
AI Race by Country vs GDP: Who Leads Both, 1960 to 2026
guideUpdated 17 min read
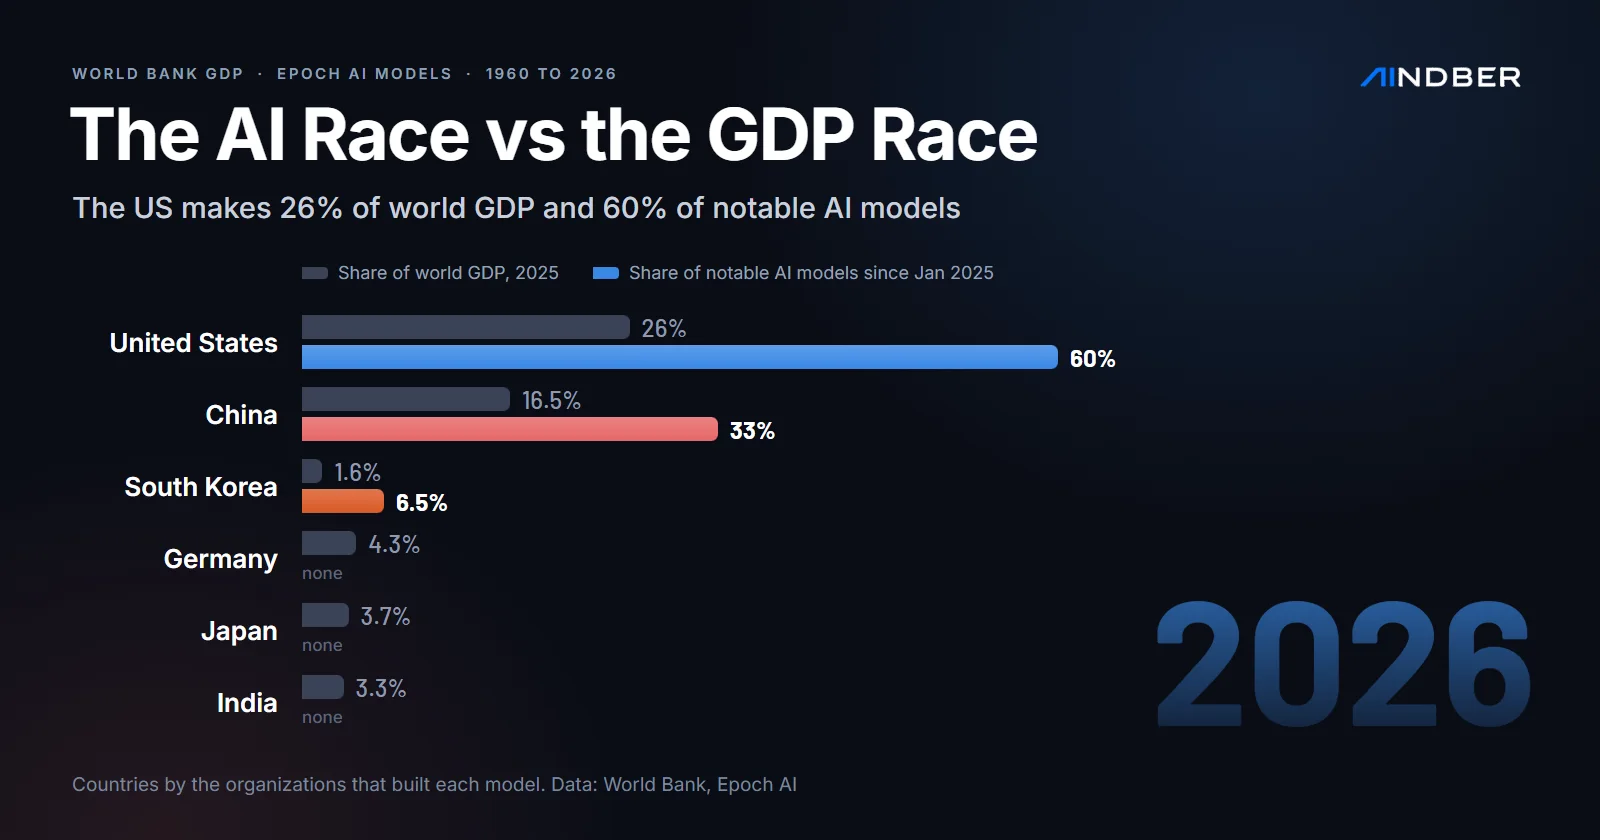
The US makes 26% of world GDP but built 60% of notable AI models since 2025. Watch countries race on GDP and AI models from 1960 to 2026, with the data.
Data pulled: 29 October 2026 (UTC). GDP runs from 1960 to 2025, the latest year the World Bank has published. AI models run to 28 October 2026, the newest release date in Epoch AI's database.
By Frankie C. · Senior Market Researcher, Mindber. Tracks 500+ AI/SaaS tools across SEA markets via the Mindber Innovation Index methodology.
How we assessed this: We pulled GDP in current US dollars for every country from the World Bank's World Development Indicators and downloaded the full Epoch AI models database. Then we counted notable and large-scale models by the country of the organizations that built them. Private investment comes from the Stanford AI Index through Our World in Data. This is analysis of public datasets, not hands-on testing, and every yearly number is in the CSV files linked under the chart.
The United States and China lead both races, and the AI race is far more lopsided than the economic one. The US produced 26% of world GDP in 2025. Organizations based there built 60% of the notable AI models released since January 2025, and American AI companies drew 83% of the world's private AI investment last year.
Our reading of the numbers below: a large economy buys a place in the AI race, not a lead in it. Germany, Japan and India are three of the six largest economies, and Epoch lists no notable model from any of them since January 2025. South Korea makes 1.6% of world output and built 13.
Press play to watch 66 years of GDP, then switch the measure under the chart to see the two AI races. The notable-model view runs from 1960. The large-scale view starts in 2019, the year the first model crossed its threshold.
Gross domestic product in current US dollars, not adjusted for inflation. Countries and territories only.
2025The UK edges back past India, by $47 billion2025: United States leads with $30,769,700,000,000
| # | Country | GDP |
|---|---|---|
| 1 | United States | $30,769,700,000,000 |
| 2 | China | $19,498,039,388,043 |
| 3 | Germany | $5,050,922,925,047 |
| 4 | Japan | $4,435,162,999,977 |
| 5 | United Kingdom | $4,002,587,541,846 |
| 6 | India | $3,956,067,115,772 |
| 7 | France | $3,366,315,927,447 |
| 8 | Russia | $2,561,310,169,359 |
| 9 | Italy | $2,551,556,954,100 |
| 10 | Canada | $2,319,899,772,426 |
| 11 | Brazil | $2,279,920,092,492 |
| 12 | Spain | $1,906,453,309,986 |
| 13 | South Korea | $1,872,374,961,553 |
| 14 | Mexico | $1,832,641,364,776 |
| 15 | Australia | $1,798,518,933,689 |
| 16 | Netherlands | $1,332,767,651,100 |
| 17 | Switzerland | $1,043,529,899,251 |
| 18 | Argentina | $683,097,891,619 |
| 19 | Sweden | $668,998,664,082 |
| 20 | Israel | $610,777,842,874 |
| 21 | Singapore | $603,869,516,999 |
| 22 | Hong Kong SAR China | $427,310,315,922 |
| 23 | Czechia | $391,026,962,800 |
| 24 | Iran | $362,682,115,433 |
| 25 | Finland | $317,039,368,820 |
| 26 | Croatia | $105,060,182,186 |
Source: World Bank, World Development Indicators · Yearly data (CSV) · Make your own chart race© 2026 Mindber
Each AI bar names a model. It is the one with the most reported training compute from that country's latest year with a release, or the most cited where compute is unknown. Open the table under the chart to read any year as plain numbers.
The same race as a film of under two minutes, with the large-scale model race added:
The economy race: one leader, and China since 2010
The US has been the largest economy in every year of the World Bank's series, which starts in 1960. Its 2025 GDP was $30.77 trillion. China's was $19.50 trillion, and the whole world's was $118.35 trillion.
China's climb is the main movement on the chart. In 2000 it ranked sixth with $1.22 trillion. It passed Germany in 2007 and Japan in 2010, when it became the second-largest economy. Its share of world GDP went from 14.9% in 2015 to 16.5% in 2025.
The US gained share too, from 24.1% to 26.0% over the same decade. Both leaders grew faster in dollar terms than the world did. US GDP rose 1.68 times between 2015 and 2025, China's 1.73 times, and the world's 1.56 times.
Japan held second place from 1972 to 2009. Then it slid. Its 2025 GDP, $4.44 trillion, sits slightly below its 2015 figure of $4.53 trillion. Germany passed it for third place in 2023. Current-dollar GDP moves with exchange rates, so a weaker yen shrinks Japan's total even in years its economy grows. The World Bank puts Japan's real growth at 1.2% in 2025.
India is the other mover. It passed the UK for fifth place in 2022 and held it through 2024. In 2025 the UK edged back ahead by $47 billion, $4.00 trillion to $3.96 trillion. India's real growth was 7.6% that year, the fastest of the ten largest economies. China grew 5.0%, the US 2.2% and the world 2.9%.
The AI race has had five runners-up
The US has led the notable-model count every year since 1960. Through 28 October 2026, American organizations worked on 704 of the 1,088 notable models in Epoch's database, or 65%.
Epoch marks a model as notable when it meets one of a few tests. It needs more than 5,000 citations, a training run above $1 million, over a million monthly users, a state-of-the-art benchmark result, or equal historical weight. The full criteria sit on the dataset page. Many of the 1,088 are research models from university labs. The rest include the large language models behind today's chatbots.
Second place is where the history shows. The UK held it from 1968 to 1974. Japan held it, sometimes tied with the UK, from 1975 to 2005. Its bars from those decades carry Kunihiko Fukushima's Cognitron and Neocognitron, early ancestors of today's image models.
Canada took second in 2006 and kept it until 2017. Those are the deep learning years at the University of Toronto and in Montreal. AlexNet, the 2012 Toronto image model often credited with starting the deep learning boom, is on Canada's bar.
The UK came back in 2018, driven by DeepMind's work in London, from AlphaGo to AlphaFold. China passed it in 2023 and now holds second with 191 notable models. The UK has 89, Canada 57, France 50 and Germany 31.
The two leaders' labs are familiar names. Since January 2025, OpenAI, which makes ChatGPT, worked on 40 of the American notable models. Google DeepMind, behind Gemini, worked on 20. Anthropic, maker of Claude, worked on 16, and Meta AI on 9.
China's list is spread wider. Alibaba worked on 21 of China's notable models since January 2025. DeepSeek and Zhipu AI each have 7, ByteDance and Moonshot 6 each, and Tencent 4. Our month-by-month race of AI brands shows how much attention each of those labs drew outside China.
A share of GDP vs a share of AI
Share of world GDP, 2025Share of notable AI models, Jan 2025 to Oct 2026
United States
Share of world GDP, 2025
26 %
Share of notable AI models, Jan 2025 to Oct 2026
60 %
China
Share of world GDP, 2025
16.5 %
Share of notable AI models, Jan 2025 to Oct 2026
33 %
Germany
Share of world GDP, 2025
4.3 %
Share of notable AI models, Jan 2025 to Oct 2026
n/a
—Japan
Share of world GDP, 2025
3.7 %
Share of notable AI models, Jan 2025 to Oct 2026
n/a
—United Kingdom
Share of world GDP, 2025
3.4 %
Share of notable AI models, Jan 2025 to Oct 2026
0.5 %
India
Share of world GDP, 2025
3.3 %
Share of notable AI models, Jan 2025 to Oct 2026
n/a
—France
Share of world GDP, 2025
2.8 %
Share of notable AI models, Jan 2025 to Oct 2026
0.5 %
South Korea
Share of world GDP, 2025
1.6 %
Share of notable AI models, Jan 2025 to Oct 2026
6.5 %
Source: World Bank WDI and Epoch AI, Mindber analysis, Oct 29, 2026
A dash means no notable model in the period. The model shares can add up to more than 100%, because a model built by organizations in two countries counts for both.
Put the two measures side by side and the AI race looks like the economic race with the middle taken out. The US share of notable models is 2.3 times its share of world GDP. China's is 2.0 times. Below them, only South Korea gets more than its economic weight, at 4.1 times.
A simpler way to read it is notable models per $1 trillion of GDP. Since January 2025, South Korea released 6.9 notable models per trillion dollars of output. The US released 3.9 and China 3.4. Canada, France and the UK each released one model, which puts them between 0.25 and 0.43. Germany, Japan, India, Italy, Russia and Brazil released none.
| Country | GDP 2025 | Share of world GDP | Notable models since Jan 2025 | Models per $1T of GDP |
|---|---|---|---|---|
| United States | $30.77T | 26.0% | 120 | 3.9 |
| China | $19.50T | 16.5% | 66 | 3.4 |
| Germany | $5.05T | 4.3% | 0 | 0 |
| Japan | $4.44T | 3.7% | 0 | 0 |
| United Kingdom | $4.00T | 3.4% | 1 | 0.25 |
| India | $3.96T | 3.3% | 0 | 0 |
| France | $3.37T | 2.8% | 1 | 0.30 |
| Canada | $2.32T | 2.0% | 1 | 0.43 |
| South Korea | $1.87T | 1.6% | 13 | 6.9 |
| Singapore | $0.60T | 0.5% | 2 | 3.3 |
Singapore's two are a reasoning model from the startup Sapient Intelligence and MolmoAct 2, a robotics model built with the Allen Institute for AI. Two models make a thin base for a ratio. The AI market data section of our learn hub explains the other figures we track for AI tools and the companies behind them.
Where the private money goes
United StatesChina
2015
United States
69.7 %
China
15.6 %
2018
United States
48.8 %
China
32.4 %
2021
United States
59.7 %
China
17.8 %
2023
United States
69.4 %
China
9.1 %
2024
United States
72.3 %
China
6.2 %
2025
United States
82.9 %
China
3.6 %
Source: Quid via AI Index Report 2026, Our World in Data, Mindber analysis, Oct 29, 2026
Private investment tells a different story from model counts. In 2018 Chinese AI companies raised 32.4% of the world's private AI money, against 48.8% for American ones. By 2025 China's share had fallen to 3.6% and the US share had risen to 82.9%.
The 2026 AI Index puts US private AI investment at $285.9 billion in 2025 and China's at $12.4 billion. Global private AI investment reached $344.66 billion, up 127.5% in a year. Those are current dollars. The shares in the chart come from Our World in Data's series in constant 2021 dollars, and a share doesn't change with the dollar basis.
The AI Index adds its own caveat, and it matters here. Private funding rounds miss China's government guidance funds, so the report says the figures likely understate China's total AI spending. That fits the model counts: Chinese labs kept releasing more models while their share of private money shrank.
The AI Index also found that generative AI took nearly half of all private AI funding in 2025. Our report on SpaceX's IPO and its AI lab follows the xAI money into the public market.
China releases more big models, the US builds the biggest
Models trained with more than 10²³ operations, by the country of the organizations that built them. 201 models in total.
China
94/201
United States
86/201
South Korea
8/201
France
3/201
Canada
2/201
Switzerland
2/201
Hong Kong
2/201
050101151201
Source: Epoch AI, large-scale AI models, Mindber analysis, Oct 29, 2026
Count only the big models and China moves ahead. Narrowly. Epoch tracks large-scale models, those trained with more than 10²³ operations of compute, a cutoff some AI laws use. Chinese organizations released 82 of them in 2025, American ones 66.
The 2026 count reverses so far, 20 American to 12 Chinese. Treat that with care: 2026 has 36 large-scale models to date, against 165 in all of 2025, so most of the year's entries aren't in yet.
The top tier is still American. Epoch marks a frontier model as one of the five largest training runs at the time of its release. Since January 2023 there have been 27, and American organizations built 25 of them. The other two are Falcon-180B from Abu Dhabi's Technology Innovation Institute in September 2023 and Zhipu AI's GLM-4-Plus in August 2024. The latest frontier model in the database is OpenAI's GPT-6 Astra, from September 2026.
The split follows from how each side releases its work. Of China's 66 notable models since January 2025, 48 are open-weight models anyone can download. Of America's 120, 15 are. A lab that gives its weights away reaches users by spreading the model, and one that keeps them closed needs the largest model to sell access. Our guide to open-source AI explains what each license lets you do.
Benchmark rank is a separate question from model count. The AI model rankings history shows which lab held first place on the Arena leaderboard each month, and our Model Arena tracks the current boards.
South Korea: a small economy with a national program
South Korea built 13 notable models between January 2025 and October 2026, more than every European country combined. All 13 are open-weight. LG AI Research made six of them, from EXAONE Deep in March 2025 to K-EXAONE 2.0 in July 2026.
Five arrived within three days at the end of 2025. Epoch dates all five between 29 and 31 December: K-EXAONE from LG, A.X K1 from SK Telecom, Solar Open 100B from Upstage, VAETKI from NC AI and a HyperCLOVA X model from Naver. Those are the companies behind the five teams the government chose for its sovereign AI foundation model project.
The Ministry of Science and ICT runs that project as a contest. In January 2026, two of the five teams failed to advance. The ministry said Naver Cloud's entry relied on fine-tuning existing overseas models. Motif Technologies joined later. In the second round, published in August, SK Telecom scored 70.6 points, Upstage 69.9, LG AI Research 69.0 and Motif 65.8, according to Edaily.
Motif-3, A.X K2, K-EXAONE 2.0 and Solar Open2 250B all followed between June and August 2026. We read it as the clearest case in this data of a government program moving a country's model count. South Korea now has 28 notable models in total, close to Germany's 31.
Big economies with almost no models: Germany, Japan, India
Three of the six largest economies barely appear in the AI race. The gaps are long. Germany's last notable model in Epoch's database is DeepL's language model from July 2024. Japan's is rinna's nekomata-14b from December 2023. India has two notable models in total, and both came from teams spread across several countries.
None of this means these countries do no AI work. The notable list measures one thing: who trains the models that set records, draw millions of users or cost millions to train.
Europe as a whole shows the same slide. European organizations worked on 31% of notable models from 2015 to 2019, 25% from 2020 to 2022, and 12% in 2023 and 2024. Since January 2025 they appear on 2 of 200, Mistral's OCR model and Stability AI's SPAR3D.
The large-scale list is kinder to Europe. It has seven European models since January 2025, three from Mistral AI and the rest from Swiss, German, Ukrainian, Polish and Bulgarian research groups. Even so, that is 7 of 201. Talent pulls toward the biggest labs too: our story on Google's AI brain drain follows Noam Shazeer to OpenAI and John Jumper to Anthropic in a single week.
The data behind the chart
This table puts the three measures together for the countries that lead any of them. The yearly series are in the GDP CSV, the notable models CSV and the large-scale models CSV.
| Country | GDP 2025 | Notable models, all time | Notable since Jan 2025 | Large-scale, all time | Large-scale since Jan 2025 |
|---|---|---|---|---|---|
| United States | $30.77T | 704 | 120 | 241 | 86 |
| China | $19.50T | 191 | 66 | 206 | 94 |
| United Kingdom | $4.00T | 89 | 1 | 8 | 0 |
| Canada | $2.32T | 57 | 1 | 7 | 2 |
| France | $3.37T | 50 | 1 | 20 | 3 |
| Germany | $5.05T | 31 | 0 | 4 | 1 |
| South Korea | $1.87T | 28 | 13 | 22 | 8 |
| Singapore | $0.60T | 17 | 2 | 2 | 1 |
| Japan | $4.44T | 11 | 0 | 4 | 0 |
| India | $3.96T | 2 | 0 | 0 | 0 |
A model counts once for each country among its builders, as Epoch records it. Three notable models list only "Multinational" as their country and 19 list none, and we left those out. Hong Kong appears on its own line in both sources, so it stays separate from China here.
GDP is in current US dollars. It mixes real growth, inflation and exchange rates, which is why Japan can grow in yen and shrink in dollars. The chart keeps the 27 countries and territories that reach the top 12 on any of the three measures, and leaves out regional totals.
The 2026 bars count models published through 28 October. Epoch updates the database daily, so those numbers will rise as it adds more of this year's releases. Our bar chart race maker can load any of the three CSV files if you want to restyle the race or cut it to fewer countries.
What these numbers can't tell you
A model count isn't a measure of quality or use. One frontier model can matter more than a dozen research papers, and the notable list treats them the same. For how models rank on tests, use the benchmark boards, which name the source of every score.
Notability is Epoch's judgment. Its staff can add a model with "notability at least as great" as the written tests. We'd expect models from countries that publish less in English to be missed more often. We counted what Epoch lists, as of 29 October 2026.
Private investment leaves out public money, as the AI Index notes for China. It also leaves out what large companies spend from their own cash on data centers and chips.
None of these sources measures how many people use AI in each country, or how much AI adds to GDP. Both questions matter for an economy, and neither has a clean cross-country series yet.
Frequently asked questions
Which country is winning the AI race in 2026?
The United States, on most measures. It worked on 60% of notable AI models since January 2025, built 25 of the 27 frontier models since 2023 and took 83% of private AI investment in 2025. China leads one count: large-scale models released in 2025, 82 to 66.
How far behind the US is China in AI?
Close on some yardsticks and far behind on others. China has 55% as many notable models as the US since January 2025, and more large-scale ones. Its private AI investment was about one twenty-third of America's in 2025, though state guidance funds sit outside that figure.
Why are the 2026 numbers lower than 2025?
The year isn't over, and the database is still filling in. Our pull counts models published through 28 October 2026. It holds 36 large-scale models from 2026 so far, against 165 for all of 2025.
Why is Hong Kong shown apart from China?
Both sources list it separately. The World Bank reports Hong Kong's GDP as its own economy, and Epoch tags models from Hong Kong universities with Hong Kong. Of Hong Kong's 15 notable models, 9 already count for China through a mainland partner, so merging the two would add 6.
Do the UAE and Saudi Arabia show up in the race?
Barely. Epoch lists three notable models from the UAE, all from 2023: Falcon-40B, Jais and Falcon-180B. Saudi Arabia has four, the latest an ALLaM model from May 2024. Neither has a notable model since January 2025.
Can I use this data in my own chart?
Yes. The three CSV files under the chart have one column per country and one row per year. Credit the World Bank and Epoch AI as the sources, both CC BY 4.0, and link back to this page for how we counted models across countries.
More from Mindber
The AI labs on these bars sell most of the tools in our large language model directory and the wider AI models category. The AI chatbot category lists the assistants built on top of them, from ChatGPT and Claude to DeepSeek and Qwen.
Sources and methodology
GDP comes from the World Bank and AI models from Epoch AI, both pulled on 2026-10-29 under CC BY 4.0. Private investment shares come from the AI Index via Our World in Data. Korean program details come from Korean news reports. No hands-on product testing.
- [1]GDP in current US dollars by country, 1960 to 2025, and the world totalWorld Bank: GDP (current US$), NY.GDP.MKTP.CD · 2026-10-29
- [2]Real GDP growth in 2025 for India, China, the US, Japan and the worldWorld Bank: GDP growth (annual %), NY.GDP.MKTP.KD.ZG · 2026-10-29
- [3]Notable, large-scale and frontier AI models with release dates, organizations, countries and access type; notability criteriaEpoch AI: Data on AI models · 2026-10-29
- [4]Private AI investment by year for the US, China, Europe and the world, in constant 2021 US dollars
- [5]US private AI investment of $285.9 billion and China's $12.4 billion in 2025; global $344.66 billion; the guidance-fund caveatStanford HAI: AI Index Report 2026, Economy chapter · 2026-10-29
- [6]Naver Cloud and NC AI fail to advance in the first round of Korea's sovereign AI foundation model projectThe Korea Herald · 2026-01-15
- [7]Ministry of Science and ICT announces the first-stage results on 15 January 2026Inven Global · 2026-01-15
- [8]Second-round scores: SK Telecom 70.6, Upstage 69.9, LG AI Research 69.0, Motif 65.8Edaily · 2026-08-27
Learn the basics on Mindber
Background for this article, from the free Mindber learning hub.
Topic guides
AI Basics lessons
Share this article
Legal notice
This publication constitutes editorial commentary on publicly available information and does not constitute financial, legal, investment, or professional advice. Product names, trademarks, and registered trademarks referenced herein are the property of their respective owners; their appearance does not imply endorsement or affiliation. Mindber's analysis reflects editorial judgment based on public signals and is subject to change without notice. Scores are not buy, sell, or hold recommendations. No commercial relationship exists between Mindber and the vendors evaluated unless separately disclosed in writing. This publication is governed by the laws of Malaysia. Any dispute arising from or in connection with this publication shall be submitted to the exclusive jurisdiction of the courts of Malaysia.